
How to perform linear regression in Excel using only a formula
Demonstrations
Linear regression is a process for modelling a response in terms of explanatory factors using a linear function.
QRS.LINEAR.REGRESSION
QRS Toolbox for Excel includes the QRS.LINEAR.REGRESSION function for performing linear regression using nothing more than a formula. The function includes options to return the same results as more expensive commercial products.
To try QRS.LINEAR.REGRESSION yourself, add QRS Toolbox to your instance of Excel and start your free trial of QRS.LINEAR.REGRESSION. Then, download and open the example workbook.
In the workbook:
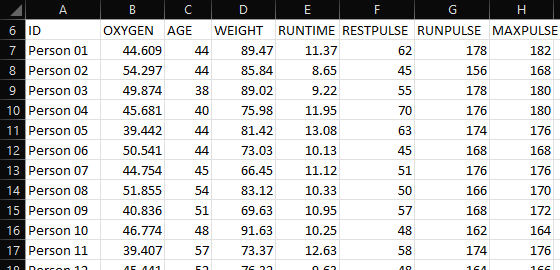
- Cells A7–A37 contain identifiers for 31 participants of a physical fitness course.
- Cells B7–B37 contain the response variable, namely oxygen rate.
- Cells C7–H37 contain factors that potentially explain the oxygen rate.
- Cells C6–H6 contain shortened names of the factors.
Constant and coefficients
=QRS.LINEAR.REGRESSION(C7:H37, B7:B37)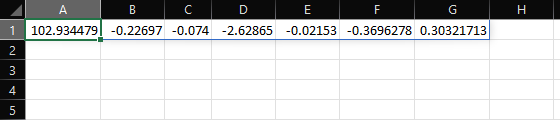
To perform a linear regression between oxygen rate and the given factors, enter the formula =QRS.LINEAR.REGRESSION(C7:H37, B7:B37) in cell A1. The result contains 7 numbers. The first number is the regression constant. The remaining 6 numbers are the coefficients of the factors.
Labels and headers
=QRS.LINEAR.REGRESSION(C7:H37, B7:B37, "LABELS", TRUE, "NAMES", C6:H6)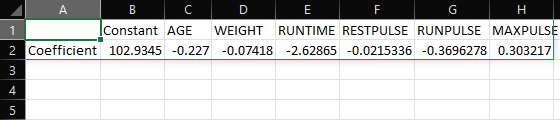
To improve the presentation of the result, add "LABELS", TRUE and "NAMES", C6:H6 to the formula. The result now contains row labels and column headers.
Significance tests
=QRS.LINEAR.REGRESSION(C7:H37, B7:B37, "LABELS", TRUE, "NAMES", C6:H6, "LRTEST", "RAG")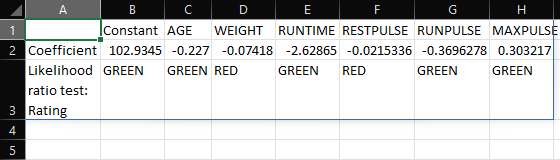
To determine the statistical significance of the factors, add "LRTEST", "RAG" to the formula. The result now contains red/amber/green ratings that summarize the likelihood ratio test for each factor.
The AGE, RUNTIME, RUNPULSE, and MAXPULSE factors all have green ratings. The other factors have red ratings. A green/amber rating means a factor is significant at the 5%/10% significance level. A red rating means a factor is not significant at the 10% significance level.
Please read the documentation to learn how to return the test statistic and p-value of the likelihood ratio test, as well as the corresponding results of the Wald test.
Significance levels
=QRS.LINEAR.REGRESSION(C7:H37, B7:B37, "LABELS", TRUE, "NAMES", C6:H6, "LRTEST", "RAG", "PGREEN", 0.3, "PRED", 0.35)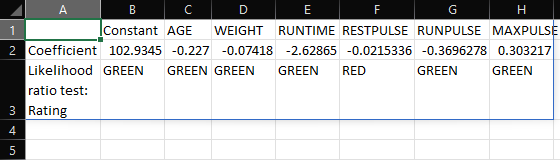
To change the significance levels from the default values of 5% and 10% to, say, 30% and 35%, add "PGREEN", 0.3 and "PRED", 0.35 to the formula. The WEIGHT factor now has a green rating too.
Manual factor selection
=QRS.LINEAR.REGRESSION(C7:H37, B7:B37, "LABELS", TRUE, "NAMES", C6:H6, "LRTEST", "RAG", "PGREEN", 0.3, "PRED", 0.35, "MASK", C5:H5)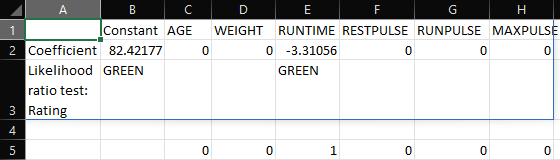
To manually select only, say, the RUNTIME factor, enter 0, 0, 1, 0, 0, 0 in cells C5–H5 and add "MASK", C5:H5 to the formula. The excluded factors now have coefficients equal to zero.
Automatic factor selection
=QRS.LINEAR.REGRESSION(C7:H37, B7:B37, "LABELS", TRUE, "NAMES", C6:H6, "LRTEST", "RAG", "PGREEN", 0.3, "PRED", 0.35, "METHOD", "STEPWISE")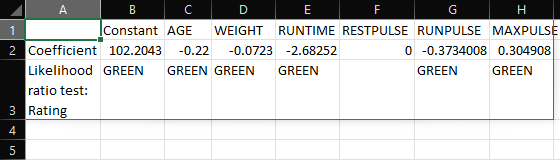
To automatically select factors using stepwise selection, remove "MASK", C5:H5 and add "METHOD", "STEPWISE" to the formula. The automatically selected factors are AGE, WEIGHT, RUNTIME, RUNPULSE, and MAXPULSE.
Please read the documentation to learn how to use forward selection or backward elimination instead, and how to control the significance levels for factor selection.
QRS.LINEAR.MODEL
You can calculate the response modelled by a linear regression in Excel using the QRS.LINEAR.MODEL function.
=QRS.LINEAR.MODEL(B$2:H$2, C7:H7)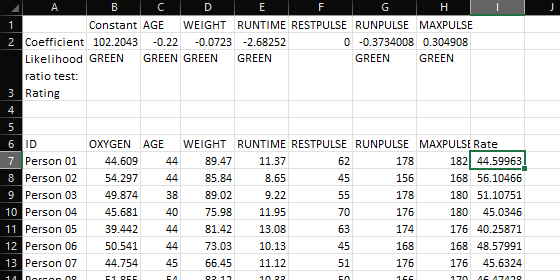
Continuing from the example above, to calculate the modelled oxygen rate, enter the formula =QRS.LINEAR.MODEL(B$2:H$2, C7:H7) in cell I7, and copy the formula across cells I8–I37.
The modelled oxygen rate for Person 01 is 44.6. The rate for Person 02 is 56.1. The rate for Person 03 is 51.1, and so on.
Final remarks
If you find QRS.LINEAR.REGRESSION useful and would like to use it beyond your free trial period, you may purchase the right to use it indefinitely for as little as USD 5.00.
Get from AppSource

Get from Excel
- Click Insert > Get Add-ins
- Search for QRS Toolbox
- Click Add